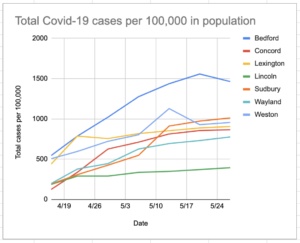
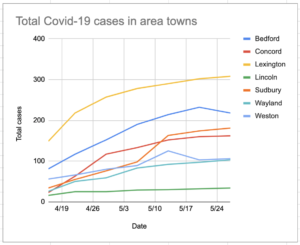
While cases of Covid-19 are still increasing in Lincoln and surrounding towns, the curves are flattening and rates of increase are slowing. For comparison, here are the total number of cases and cases per 100,000 residents in some larger cities and towns. (Source: Mass.gov)
| Year | 2009 | 2010 | 2011 | 2012 | 2013 | 2014 | 2015 | 2016 | 2017 | 2018 | 2019 |
|---|---|---|---|---|---|---|---|---|---|---|---|
| TTHMs (ppb) | 36.8 | 54.2 | 29.3 | 56.1 | 69.2 | 74.7 | 73.7 | 73.7 | 83 | 79 | 83 |
Click either chart to enlarge:
[lgc_column grid=”50″ tablet_grid=”50″ mobile_grid=”100″ last=”false”]

[/lgc_column]

Looks like social distancing by zoning may have more than a few rewards…past generations might have had more foresight than we have given them credit for!
Sara Mattes